
Understanding High CPU Usage: Why Your Computer Is Slowing Down
What Does “High CPU Usage” Actually Mean?
CPU usage measures the percentage of processor capacity that active threads consume at any moment. A value near 0 % means the chip is idle; a value close to 100 % indicates every core is fully occupied.
In 2026 most desktops ship with 6‑to‑16‑core CPUs that can run at variable frequencies. The operating system reports a single aggregate percentage, but each core can be at a different load. When the aggregate stays above 80 % for several minutes while you’re only browsing the web, something is wrong.
Common Symptoms of Processor Overload
- Laggy mouse cursor or stuttering UI animations.
- Audio crackles, video frame drops, or choppy gaming frames.
- Fans ramp up to full speed and the chassis feels hot.
- Applications take seconds to open or freeze completely.
The Impact of Thermal Throttling on Performance
Modern silicon protects itself by reducing clock speeds once temperatures cross design limits (≈90 °C on desktop, ≈85 °C on laptops). This “thermal throttling” appears as a sudden dip in clock frequency while the CPU usage counter stays high, creating the illusion that the processor is working harder than it actually is. Monitoring temperature alongside usage is essential for accurate diagnosis.
Initial Diagnostics: How to Identify the Resource Hog
Using Task Manager for Windows Users
- Press Ctrl+Shift+Esc to open Task Manager.
- Click the Processes tab and sort by the CPU column.
- Identify any process that consistently stays in the top‑three rows.
- Right‑click the suspect process → Go to details → note the PID.
- Open Resource Monitor (type “resmon” in the Start menu) and filter by that PID to see I/O, memory, and disk activity.
If the top process is svchost.exe, use “Go to service(s)” to reveal which Windows service is responsible.
Mastering Activity Monitor on macOS
- Launch Activity Monitor from /Applications/Utilities.
- Select the CPU tab and click the % CPU column header.
- Look for processes that stay above 20 % on a multi‑core Mac (e.g., M2 Pro).
- Press ⌘+I on a highlighted process to view open files and network sockets.
- Use the Energy tab to spot background daemons that waste cycles.
Using “top” and “htop” for Linux Distributions
# Show a live, color‑rich view with per‑core bars
htop

# Show only processes that consume more than 5 % CPU
top -b -n 1 | awk '$9 > 5 {print}'
Press F6 in htop to sort by CPU, then F4 to filter by name. For deeper insight, run:
# Record a 60‑second snapshot of CPU time per process
pidstat -u 1 60
When you see a high‑CPU systemd service, use systemctl status <service> to investigate.
Step‑by‑Step Solutions to Lower CPU Usage
Managing Background Applications and Startup Programs
- Open the startup manager (Task Manager → Startup tab on Windows; System Settings → Login Items on macOS;
systemctl list-unit-files --type=servicefor Linux). - Disable anything you don’t need every boot (e.g., Adobe Updater, Dropbox, Teams).
- Reboot and verify that idle CPU drops below 10 %.
Tip: On Windows, run msconfig → Services → check “Hide all Microsoft services” before disabling third‑party entries.
Updating Outdated Drivers and OS Patches
Stale chipset, GPU, or storage drivers often generate kernel‑mode CPU spikes (high “System Interrupts”).
- Windows:
winget upgrade --allor use the manufacturer’s driver‑update utility. - macOS: Open System Settings → General → Software Update and install the latest 13.x release.
- Linux:
sudo apt update && sudo apt full-upgrade(Debian/Ubuntu) orsudo dnf upgrade(Fedora).
Scanning for Malware and Resource‑Heavy Bloatware
- Run Windows Defender Offline or Malwarebytes for a full system scan.
- On macOS, launch Malwarebytes for Mac and scan the startup folder.
- On Linux, install
clamavand runclamscan -r /(exclude/procand/sys).
If a cryptominer is the culprit, you’ll see a process named minerd or similar consuming 100 % of a core.
Adjusting Power Management Settings for Efficiency
Power plans can mask or exaggerate CPU load.
- Windows:
powercfg /listto view plans;powercfg /setactive SCHEME_BALANCEDfor a balanced profile. - macOS: System Settings → Battery → “Low Power Mode” (laptops) or “Energy Saver” (desktops).
- Linux: Install
tlp(sudo apt install tlp) and enable it withsudo tlp start.
Run powercfg /energy on Windows to generate a report that highlights any power‑related inefficiencies.
Disabling Non‑Essential System Services
On Windows, services like SysMain (Superfetch) can cause brief spikes on SSD systems.
# Disable SysMain
sc config SysMain start= disabled
net stop SysMain
On Linux, mask rarely used timers:
# Disable the Bluetooth service if you never use it
sudo systemctl mask bluetooth.service
Always test after disabling a service; re‑enable it if you notice functional regressions.
Hardware Optimizations and Best Practices
Cleaning Dust and Improving Airflow
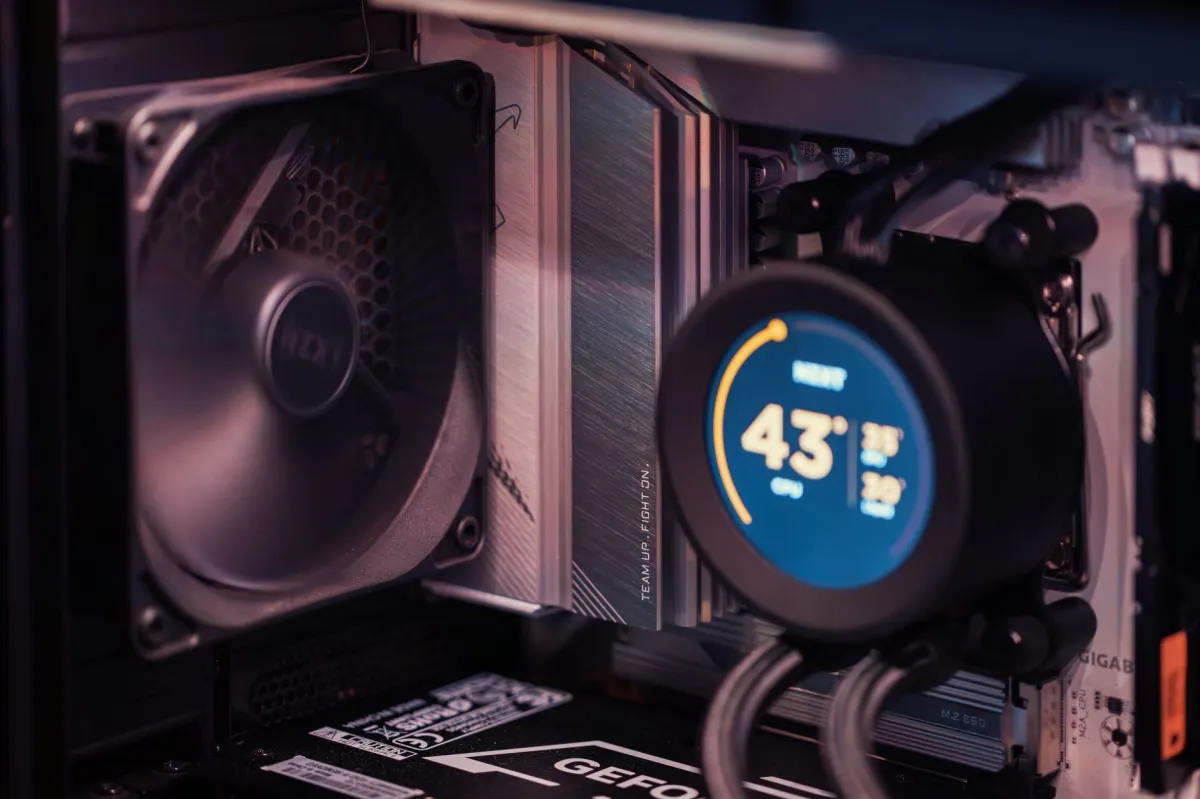
Dust accumulation raises ambient temperature, forcing the CPU to throttle earlier. Follow these steps:
- Power down, unplug, and press the power button for 10 seconds to discharge capacitors.
- Remove the side panel, use a compressed‑air can to blow out the heatsink, fans, and filters.
- Check that case fans are oriented correctly (intake front/bottom, exhaust rear/top).
- Re‑assemble and verify fan speeds in BIOS/UEFI or with
HWMonitor.
Replacing Thermal Paste for Better Heat Dissipation
Thermal paste dries out after 2‑3 years. Re‑application reduces junction temperature by up to 10 °C.
- Remove the CPU cooler, clean old paste with isopropyl alcohol (≥90 %).
- Apply a pea‑sized dot of high‑performance paste (e.g., Arctic MX‑5).
- Re‑mount the cooler, tightening screws in a diagonal pattern.
- Boot and monitor temperatures with
Core Temporsensors.
When to Consider a CPU or RAM Upgrade
Upgrade triggers:
- Consistently hitting 100 % on 4‑core CPUs while running modern games or AI inference workloads.
- Frequent page‑file activity (high disk I/O) despite low CPU, indicating memory pressure.
- BIOS/UEFI reports “CPU is throttling” even after cleaning and re‑pasting.
In 2026, the price‑to‑performance sweet spot for a mainstream desktop is an AMD Ryzen 7 7800X3D paired with 32 GB DDR5‑5600.
Common Mistakes When Fixing CPU Spikes
The Danger of Ending Critical System Processes
Killing svchost.exe, csrss.exe, or lsass.exe can crash Windows. Always use “Go to service(s)” first, then research the service name before terminating.
Over‑Tuning Power Settings: Performance vs. Battery Life
Setting laptops to “High performance” forces the CPU to run at max frequency, raising temperatures and draining the battery. Use “Balanced” for day‑to‑day work and switch to “High performance” only during short, intensive sessions.
Ignoring BIOS/UEFI Updates
Firmware patches often fix microcode bugs that cause excessive kernel‑time usage. Check the motherboard vendor’s website quarterly and apply the latest BIOS with fwupd on Linux or the vendor’s Windows utility.
Optimization Guide: Who Should Use Which Method?
Below is a quick matrix that matches typical user personas with the most effective fixes.
| User Profile / Target Persona | Recommended Choice / Approach | Key Reason & Benefits |
|---|---|---|
| Beginner / Casual User | Disable unnecessary startup items and run a full malware scan. | Quick win, minimal risk, immediate reduction in idle CPU. |
| Power User / Gamer | Update GPU/chipset drivers, clean dust, replace thermal paste, and set a “Balanced” power plan. | Reduces thermal throttling, keeps frame rates stable. |
| Developer / Content Creator | Fine‑tune process affinity, use performance counters, and keep the OS patched. | Improves compile times and reduces background compile‑time spikes. |
| Budget Hunter | Disable SysMain, trim startup programs, and monitor with free tools (HWMonitor, Process Explorer). | Zero‑cost fixes that squeeze existing hardware. |
| Enterprise / Server Admin | Implement automated alerts (PowerShell/Prometheus), enforce firmware updates, and use cgroup limits for containers. | Prevents SLA breaches and scales workloads without manual intervention. |