
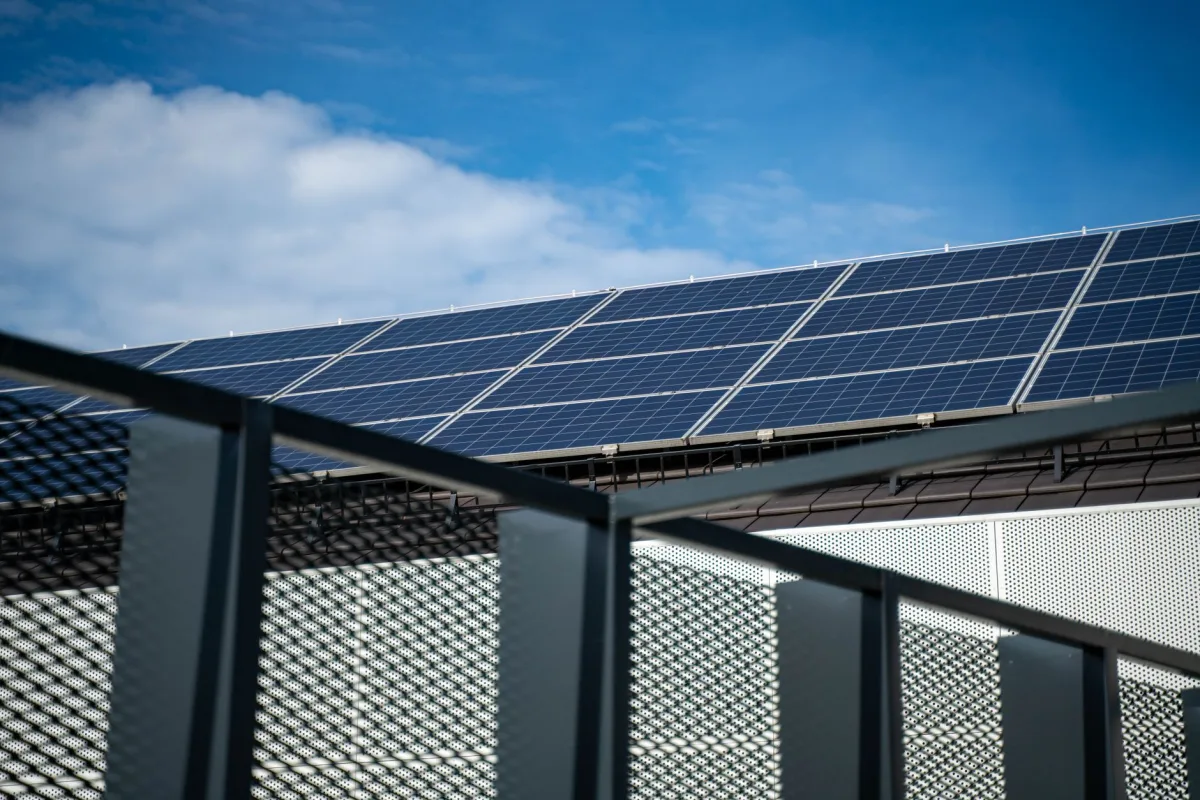
Executive Summary: Solar Panels vs Grid Electricity
Quick Comparison Table
| Aspect | Solar Panels | Grid Electricity | Winner |
|---|---|---|---|
| Up‑front Cost | $15,000‑$30,000 (typical residential 6‑10 kW) | None (pay‑as‑you‑go) | Grid Electricity |
| Long‑term Savings | 6‑10 yr payback; protects against 3‑5 % annual rate hikes | Subject to ongoing rate increases | Solar Panels |
| Reliability (Uptime) | 70‑90 % self‑supply; higher with battery backup | ≥99.95 % in most regulated markets | Grid Electricity |
| Environmental Impact | Zero operational emissions; 1‑3 yr carbon payback | Mix of renewables & fossil fuels; ~40 % low‑carbon in U.S. | Solar Panels |
| Scalability | Modular; add panels or batteries as needed | Unlimited at point of use; utility scales centrally | Tie |
The State of Energy in 2026
By 2026, global solar capacity surpassed 1 TW, and the average residential solar‑plus‑storage system now delivers 22‑24 % conversion efficiency thanks to bifacial and tandem perovskite‑silicon cells. Utility grids have embraced more renewables, but natural‑gas peaker plants still provide a sizable share of baseload power in many regions. Net‑metering rules vary widely: some states offer full retail credit, while others limit export to 50 % of consumption.
What is Solar Panels? Photovoltaic (PV) modules that convert sunlight directly into DC electricity. A typical residential system includes panels, a mounting structure, an inverter (or micro‑inverters), and optionally a battery storage pack.
What is Grid Electricity? The centralized network that generates, transmits, and distributes AC power to homes and businesses. Utilities own the generation assets, high‑voltage transmission lines, and distribution feeders that deliver energy on demand.
Understanding Solar Panels: The Power of Photovoltaics
How Solar Energy Works
When photons strike a semiconductor wafer, they free electrons, creating a flow of DC current. Inverters transform this DC into grid‑compatible AC, synchronizing voltage and frequency with the utility. Modern smart inverters can also provide grid‑forming services, allowing a solar‑plus‑battery system to operate independently during outages.
Types of Solar Installations (On‑Grid, Off‑Grid, Hybrid)
- On‑Grid (grid‑tied): Connected to the utility; excess energy is exported under net‑metering or feed‑in tariffs.
- Off‑Grid: Independent system with battery storage; used in remote cabins, islands, or RVs.
- Hybrid: Grid‑tied with battery backup; can island during outages while still receiving grid support when needed.
Modern Efficiency Standards in 2026
Commercial panels now routinely achieve 22‑24 % efficiency. Bifacial designs capture reflected light from the ground, adding 5‑8 % more energy. Perovskite‑silicon tandem cells, still under limited warranty, push lab efficiencies above 30 % but are not yet mass‑produced.
Understanding Grid Electricity: The Traditional Utility Model
How the Electrical Grid Operates
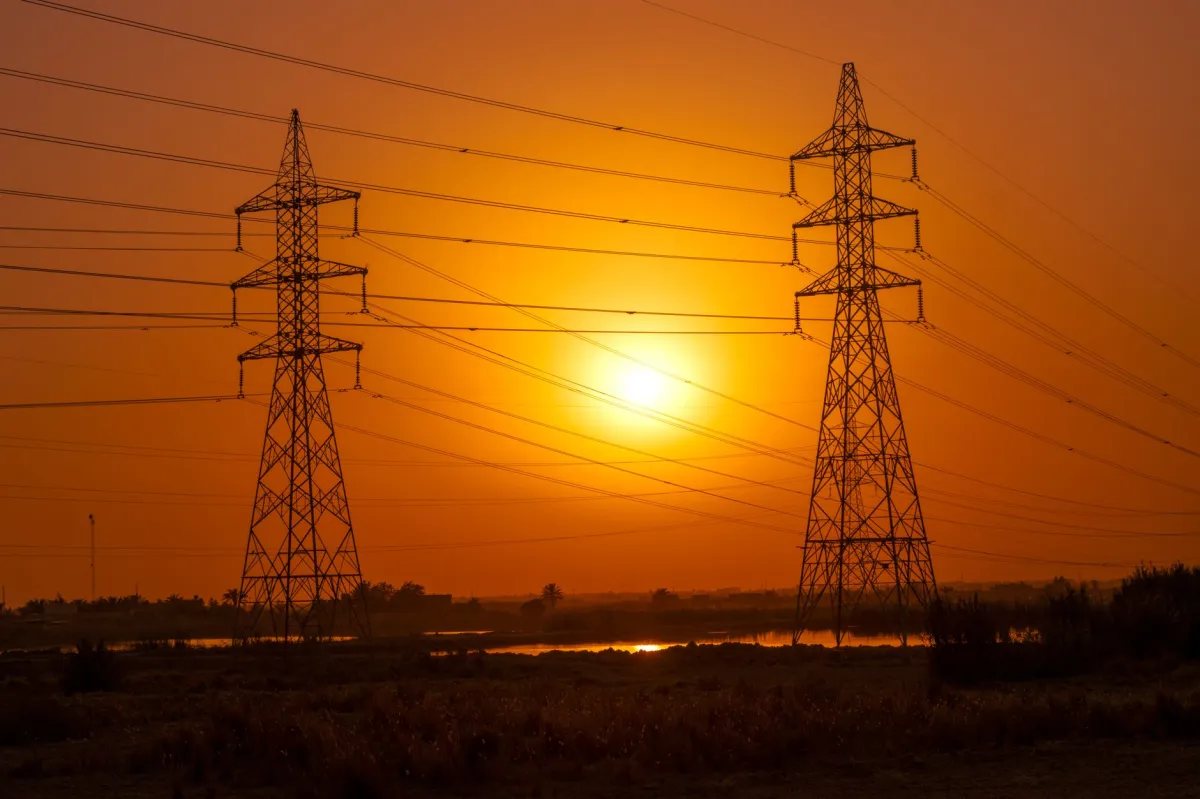
The grid balances generation and demand in real time through a hierarchy of generation plants, high‑voltage transmission, and local distribution lines. Automatic generation control (AGC) and frequency regulation keep the system stable at 60 Hz (North America) or 50 Hz (most other regions).
The Role of Utility Companies
Utilities own the generation fleet (coal, natural gas, nuclear, hydro, wind, solar), transmission corridors, and distribution networks. They also manage billing, customer service, and regulatory compliance. In deregulated markets, customers can select a retailer while the grid operator maintains the physical network.
Grid Infrastructure and Stability
Redundancy is built into transmission corridors, and substations contain protective relays that isolate faults within milliseconds. In most developed markets, the grid meets a 99.95 % reliability target, translating to less than 4 hours of outage per year on average.
Head-to-Head Feature Comparison
Energy Reliability and Uptime
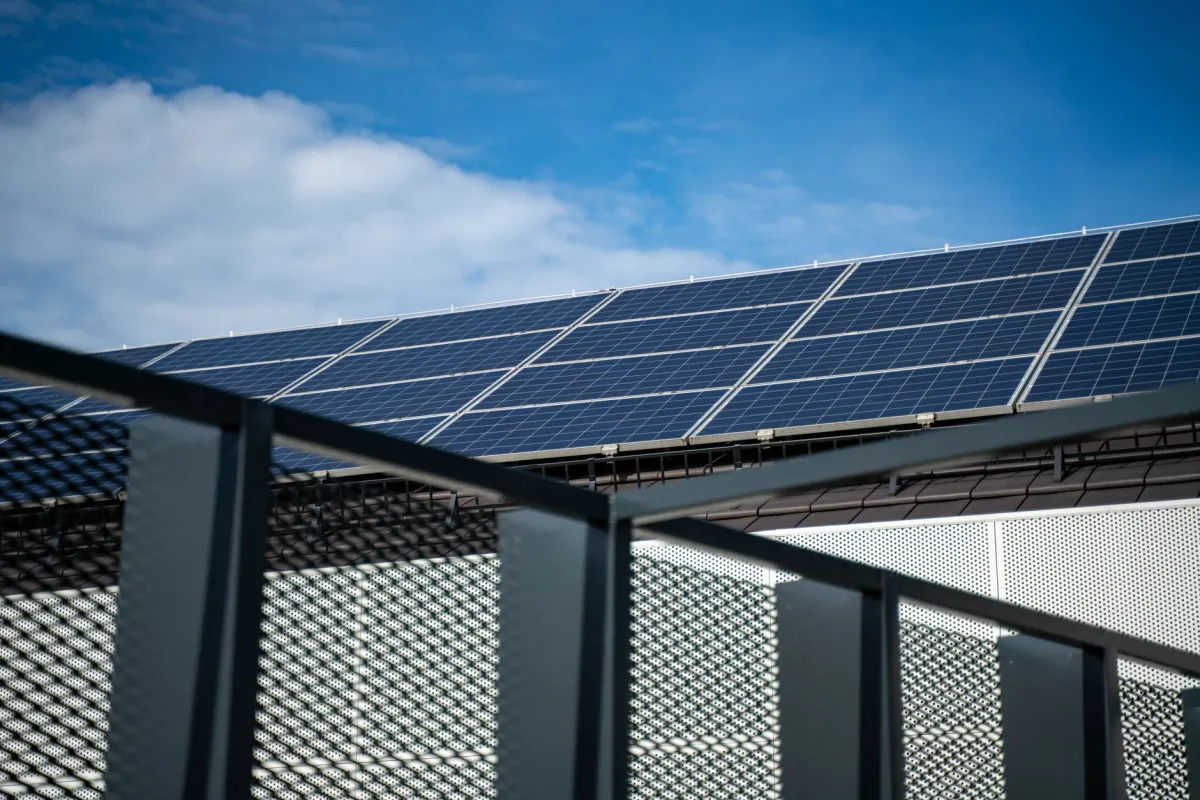
Solar output fluctuates with weather and daylight, delivering a typical capacity factor of 10‑30 %. Adding a battery can raise effective uptime to 90 % for critical loads, but the system still depends on sunlight for recharge.
Environmental Impact and Carbon Footprint
Solar panels generate no emissions during operation. Lifecycle analyses show a carbon payback period of 1‑3 years, after which the system provides clean power for its 25‑30‑year design life. Grid electricity’s carbon intensity varies by region; in 2026 the U.S. average is roughly 0.45 kg CO₂/kWh.
Installation Complexity vs. Immediate Access
Solar installations require site assessment, permitting, structural engineering, and professional mounting. Once commissioned, maintenance is limited to periodic cleaning and inverter replacement after 12‑15 years. Grid electricity is “plug‑and‑play”: the utility handles all generation and delivery.
Long‑term Scalability and Flexibility
Solar systems are modular: homeowners can start with a 4 kW array and expand later. Batteries add flexibility for load shifting or backup. Grid electricity, by contrast, scales centrally; the end user never worries about capacity limits unless the local transformer is overloaded.
| Feature / Category | Solar Panels | Grid Electricity | Winner |
|---|---|---|---|
| Core Architecture | Standard Solar Panels Specs | Standard Grid Electricity Specs | Tie |
| Connectivity | Module / Expansion dependent | Integrated / Native | Grid Electricity |
| Use Case Focus | General / Prototyping | Connected / Automation | Solar Panels |
| Performance & Reliability | Weather‑dependent; 70‑90 % uptime | ≥99.95 % uptime | Grid Electricity |
| Ease of Use | Requires design & permitting | Zero installation effort | Grid Electricity |
| Customization | Highly customizable (size, tilt, storage) | Limited to rate plans & demand‑response enrollment | Solar Panels |
| Price & Value (2026) | 6‑10 yr payback; protects against rate inflation | Pay‑as‑you‑go; exposed to 3‑5 % annual hikes | Solar Panels |
| Environmental Impact | Zero operational emissions | Mixed fossil & renewable mix | Solar Panels |
| Scalability & Flexibility | Modular expansion possible | Unlimited at point of use | Tie |
Verdict: For pure convenience and immediate reliability, grid electricity leads. For long‑term cost control, carbon reduction, and energy independence, solar panels take the edge. Most households benefit from a hybrid approach that combines both.
Pros and Cons Breakdown
Solar Panels: Advantages and Disadvantages
- Zero fuel cost after installation.
- Reduces exposure to utility rate volatility.
- Eligibility for federal ITC (30 % in 2026) and many state rebates.
- Requires substantial upfront capital.
- Production varies with weather and season.
- Installation timeline can be 4‑8 weeks.
Grid Electricity: Advantages and Disadvantages
- No capital outlay; pay only for consumption.
- Near‑continuous availability.
- Utility handles maintenance and upgrades.
- Subject to ongoing rate hikes and possible future carbon taxes.
- Limited control over energy source mix.
- Transmission losses (~5 %) reduce overall efficiency.
When to Choose Solar Panels vs Grid Electricity
Evaluating Your Geographic Location
Solar irradiance maps show that the Southwest U.S. averages 6‑7 kWh/m²/day, while the Pacific Northwest averages 3‑4 kWh/m²/day. High‑irradiance zones yield faster paybacks. In areas with frequent cloud cover, consider a larger battery bank or a grid‑tied approach.
Analyzing Your Monthly Energy Consumption
Households drawing >1,200 kWh/month (large HVAC, EV charging) may need a larger solar array plus storage to cover peak demand. If consumption stays below 500 kWh/month, a modest 4 kW system could offset 70‑80 % of usage.
Considering Local Incentives and Tax Credits
Many states still offer a state‑level solar tax credit (10‑25 %). Some utilities provide “grid‑friendly” tariffs that reward self‑consumption with lower rates. Verify net‑metering caps; a 100 % credit makes solar financially attractive, while a 50 % cap lengthens the payback period.
Decision Guide: Who is Each Best For?
Persona Mapping: The Eco‑Conscious Homeowner
Owns a single‑family house with a south‑facing roof, plans to stay 10+ years, and wants to reduce carbon footprint. Solar + battery + net‑metering provides both savings and resilience.
Persona Mapping: The Budget‑Focused Renter
Lacks ownership of the dwelling, moves within 3 years, and prefers predictable monthly expenses. Grid electricity is the logical choice.
Persona Mapping: The Remote Off‑Grid Resident
Lives in a cabin 30 miles from the nearest pole; extending the grid would cost >$50,000. A standalone solar‑plus‑storage system is the only viable solution.
Persona Mapping: The High‑Demand Industrial User
Operates a manufacturing line with >500 kW continuous load. Grid electricity delivers the required baseload; solar can supplement but not replace the primary supply.
| User Persona / Profile | Recommended Choice | Key Reason & Best Fit |
|---|---|---|
| Eco‑Conscious Homeowner (30‑60 y, 6‑10 yr horizon) | Solar Panels (with battery) | Long‑term savings, carbon reduction, ability to island during outages. |
| Budget‑Focused Renter (1‑3 y stay) | Grid Electricity | No upfront cost, immediate access, flexibility to move. |
| Remote Off‑Grid Resident (isolated property) | Solar Panels (off‑grid) | Grid extension uneconomical; solar provides independent power. |
| High‑Demand Industrial User (continuous 500 kW+) | Grid Electricity (primary) + Solar Supplemental | Grid meets baseload; solar can offset peak demand and lower carbon intensity. |
SWOT Analysis: Solar Panels vs Grid Electricity
| Solar Panels | Grid Electricity | |
|---|---|---|
| Strengths | Zero fuel cost, low operational emissions, modular design, tax incentives. | High reliability, no installation barrier, unlimited capacity, regulated pricing. |
| Weaknesses | High upfront capital, weather‑dependent output, longer ROI in low‑irradiance zones. | Exposure to rate inflation, carbon emissions from fossil‑fuel plants, limited consumer control. |
| Opportunities | Advances in perovskite tandems, falling battery costs, virtual power plant (VPP) participation. | Increasing renewable mix, dynamic pricing that rewards demand response, smart‑grid integration. |
| Threats | Policy rollbacks, supply‑chain constraints for silicon & rare‑earths, battery safety concerns. | Potential carbon taxes, grid modernization costs passed to consumers, cyber‑security risks in smart grids. |
Final Verdict: Which is Right for You in 2026?
The Cost‑Benefit Summary
Solar panels require a sizable initial outlay but deliver long‑term savings, a hedge against rising rates, and a clear environmental benefit. Grid electricity offers immediate convenience, near‑perfect reliability, and zero capital risk, but leaves you vulnerable to price volatility and carbon emissions.
Final Recommendation Based on Priority
- If your priority is financial predictability and low upfront cost: Choose grid electricity.
- If your priority is long‑term savings, carbon reduction, and energy independence: Invest in a solar‑plus‑storage system.
- If you need the best of both worlds: Install solar panels with a modest battery and stay grid‑connected for backup and net‑metering.
In 2026, the market is moving toward hybrid solutions. By combining solar generation, battery storage, and a reliable grid connection, most homeowners can achieve a balanced portfolio that maximizes savings while preserving resilience.