
Understanding Planetary Defense: How NASA Monitors the Skues
What are Near-Earth Objects (NEOs)?
NEOs are comets or asteroids whose orbits bring them within 1.3 AU of the Sun, crossing—or coming close to—Earth’s orbital path. They range from a few meters to several kilometers in diameter. The most hazardous subset, Potentially Hazardous Asteroids (PHAs), have a Minimum Orbit Intersection Distance (MOID) ≤ 0.05 AU and an absolute magnitude H ≤ 22, which usually means they are at least 140 m across.
A Near‑Earth Object (NEO) is any small Solar‑System body whose perihelion distance is less than 1.3 AU, allowing it to approach Earth’s orbit closely enough to pose a potential impact risk.
The Role of the Planetary Defense Coordination Office (PDCO)
Created in 2016, the PDCO sits within NASA’s Science Mission Directorate and acts as the national hub for asteroid detection, impact analysis, and mitigation planning. Its annual budget in FY 2026 exceeds $150 million, split among:
- Survey support (Catalina Sky Survey, Pan‑STARRS, ATLAS)
- Radar operations (Goldstone Deep Space Communications Complex)
- Impact‑monitoring software (Sentry, Scout)
- International liaison through the International Asteroid Warning Network (IAWN)
PDCO coordinates with ESA’s Space Situational Awareness program, JAXA’s Hayabusa missions, and dozens of amateur astronomy groups to ensure that observations from any corner of the globe feed into the same orbit‑determination pipeline.
The Toolkit: Technologies Used to Detect Asteroids
Optical Telescopes and Wide‑Field Surveys
Ground‑based optical surveys dominate the discovery rate. The three main assets are:
- Catalina Sky Survey (CSS) – three 0.7 m telescopes in Arizona scanning the sky three times per night, reaching visual magnitude 21.5.
- Panoramic Survey Telescope and Rapid Response System (Pan‑STARRS) – a 1.8 m telescope in Hawaii with a 7 deg² field of view, capable of detecting objects as faint as magnitude 23.
- Asteroid Terrestrial‑Impact Last Alert System (ATLAS) – a network of four 0.5 m telescopes that prioritize rapid, all‑sky coverage to provide days‑to‑weeks warning for 10‑140 m bodies.
Each survey runs its own detection algorithm. CSS uses a sliding‑window matched‑filter to flag moving point sources; Pan‑STARRS employs a difference‑imaging pipeline that subtracts a static sky model; ATLAS relies on a simple linear‑track detector optimized for speed.
The Power of Planetary Radar (Goldstone)
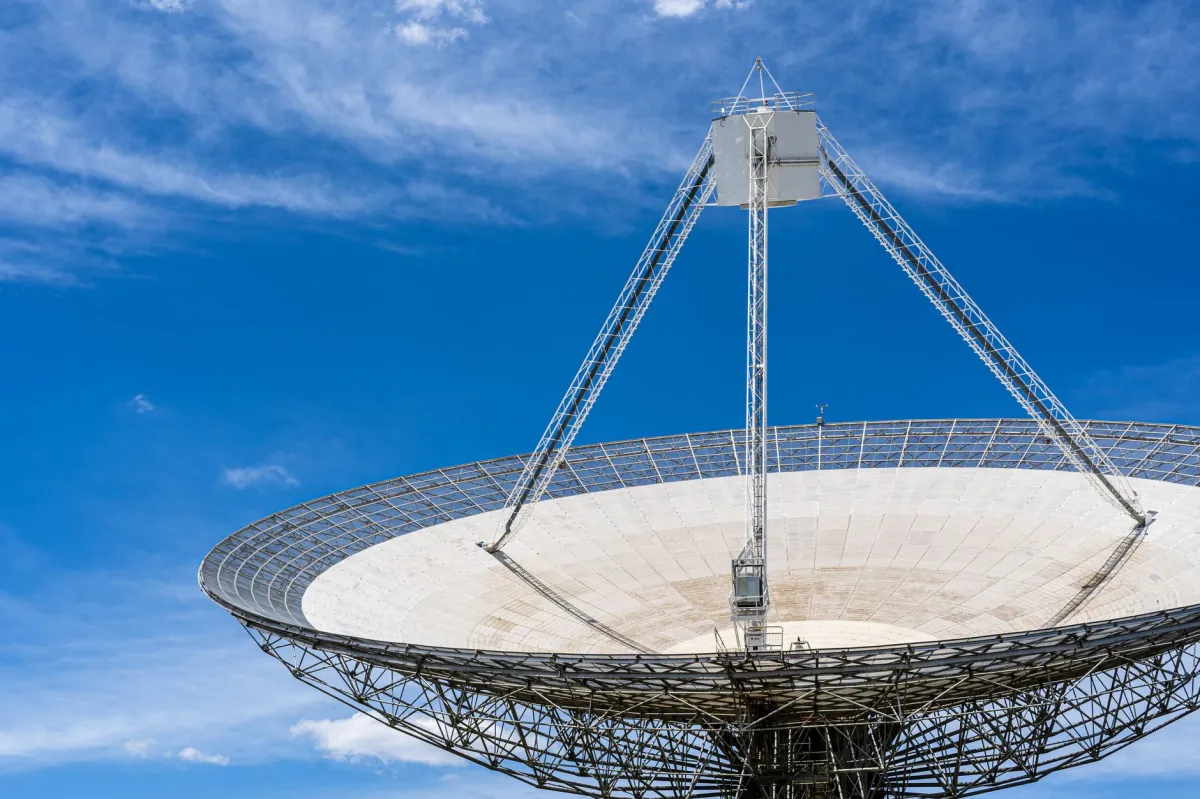
When a newly discovered NEO approaches within ~0.3 AU, NASA schedules radar ranging at the 70‑m antenna of the Goldstone Deep Space Communications Complex. Radar measures distance to a few meters and radial velocity to centimeters per second, collapsing orbital uncertainties by up to three orders of magnitude. The echo also reveals surface roughness and rotation period, informing both impact risk and potential deflection strategies.
Space‑Based Observatories: NEOWISE and Beyond
NEOWISE, the repurposed Wide‑field Infrared Survey Explorer launched in 2009, scans the sky in 3.4 µm and 4.6 µm bands. Infrared detects thermal emission, allowing size estimation independent of albedo. As of 2026, NEOWISE has contributed over 30 % of all diameter measurements for known PHAs.
The upcoming NEO Surveyor, slated for launch in 2028, will operate exclusively in the 6–10 µm range, closing the “solar blind spot” by observing objects that approach from the Sun’s direction.
The 2026 Integration of AI in Orbit Detection
Machine‑learning classifiers now ingest raw image streams from all three ground surveys. A convolutional neural network flags candidates with a false‑positive rate under 2 %. An ensemble of Bayesian models then predicts preliminary orbital elements within minutes, feeding directly into the Sentry pipeline. Early tests show a 15 % reduction in the time from first sighting to a reliable impact probability estimate.
The Tracking Process: From Discovery to Orbit Calculation
Step 1: Initial Detection and Sighting
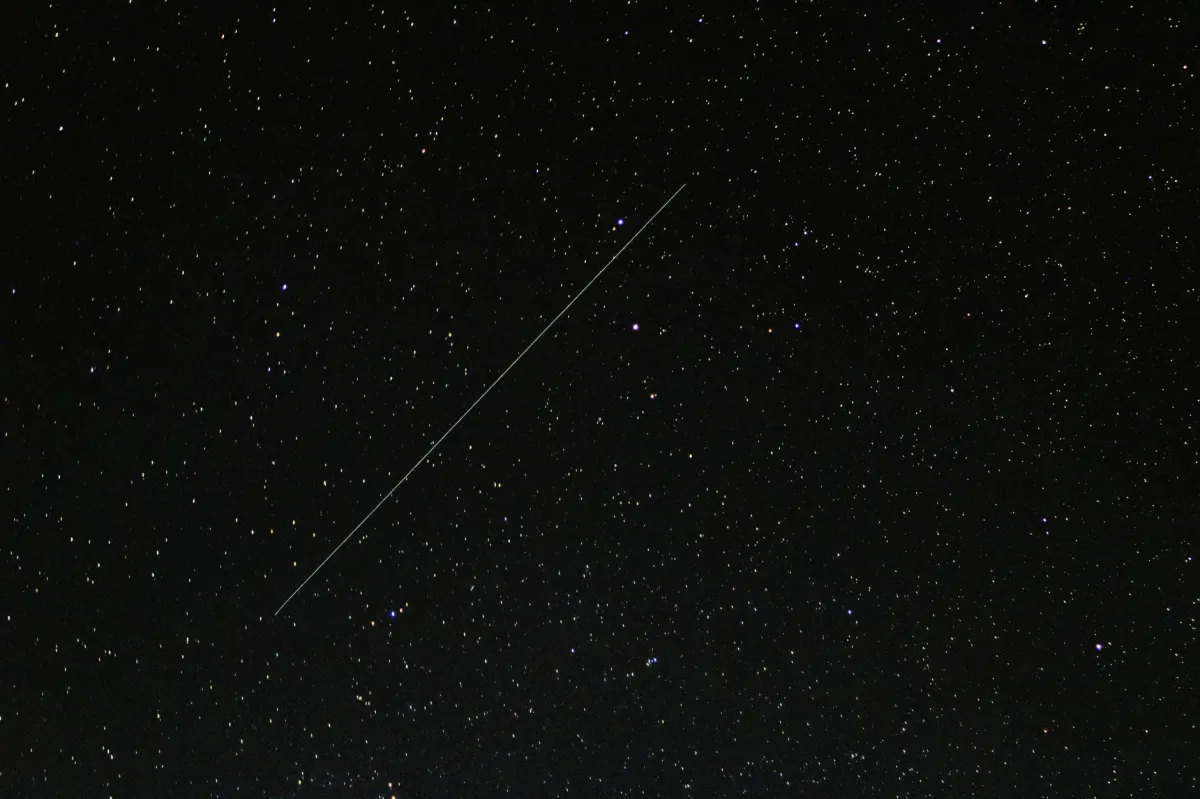
- Survey camera captures a series of exposures (typically three per field, spaced 15 min apart).
- Automated pipeline extracts moving sources, discards stationary stars, and produces a list of tracklets (short arcs).
- Tracklets are uploaded to the Minor Planet Center (MPC) where they receive a provisional designation.
At this stage, the object’s position uncertainty spans thousands of kilometers, so the PDCO issues a “watch” alert to partner observatories.
Step 2: Establishing the Orbital Path
Follow‑up observations from a global network—including professional telescopes, university facilities, and citizen‑science participants—extend the arc length. NASA’s orbit‑determination software applies a weighted least‑squares fit, then runs a Monte Carlo simulation that generates thousands of orbital “clones.” Bayesian inference updates the probability distribution as each new measurement arrives, rapidly shrinking the uncertainty ellipse.
Step 3: Calculating the ‘Impact Probability’ (The Palermo Scale)
Sentry consumes the clone cloud and propagates each orbit forward for 100 years, accounting for planetary gravitation, relativistic corrections, and the Yarkovsky thermal thrust. The system tallies the fraction of clones that intersect Earth’s sphere of influence, converting this raw probability into a Palermo Scale value:
log10( (P_impact / 1e-6) / (time_to_impact / 100) )A Palermo value of –2 or lower indicates a risk far below the background level; values above 0 would signal a threat worthy of public communication.
Step 4: Continuous Monitoring and Refinement
Even after an impact probability stabilizes, NASA continues to collect data. Radar ranging, when available, replaces the Monte Carlo cloud with a deterministic solution. The Scout impact‑monitoring system runs parallel to Sentry, focusing on long‑term (century‑scale) threats and incorporating non‑gravitational forces like the Yarkovsky effect. Updated results appear instantly on the CNEOS “Close Approach” page.
Comparing Detection Methods: Radar vs. Optical
| Metric | Optical Surveys | Planetary Radar |
|---|---|---|
| Typical detection range | ≤ 1.5 AU (depends on size and albedo) | ≤ 0.3 AU (requires close approach) |
| Primary data product | Apparent magnitude, sky position | Round‑trip time, Doppler shift |
| Precision of distance | ~10⁴ km (initial) | ~10 m (radar ranging) |
| Composition clues | Albedo inference, lightcurve | Surface roughness, spin state |
| Cost per observation | Low (automated nightly runs) | High (requires large antenna time) |
| Coverage cadence | Full sky every 2–3 nights (CSS, Pan‑STARRS) | Targeted, only when object is close |
Challenges and Limitations in Asteroid Tracking
The ‘Blind Spot’: Dealing with Solar Interference
Objects approaching from the Sun’s direction remain invisible to ground‑based optical telescopes. Infrared space assets mitigate this, but the current fleet cannot observe within 45° of solar elongation. The NEO Surveyor’s planned sun‑shielded orbit will shrink this blind spot dramatically.
Small Object Detection Gaps
Objects under 10 m generally disintegrate in the atmosphere, yet they can still cause local damage (e.g., the 2018 Chelyabinsk event). ATLAS provides the best early warning for this size class, but detection confidence drops sharply below magnitude 22. Ongoing research into high‑frame‑rate wide‑field cameras aims to improve sensitivity.
The Difficulty of Tracking Dark (Low‑Albedo) Asteroids
Low‑albedo bodies reflect little sunlight, making them hard to spot in visible light. Infrared surveys estimate size by measuring thermal emission, but they require precise calibration against known standards. Until NEO Surveyor launches, NASA relies on a hybrid approach: optical discovery followed by infrared follow‑up with NEOWISE or ground‑based thermal imagers.
Who Should Follow Planetary Defense Data?
| User Profile / Target Persona | Recommended Choice / Approach | Key Reason & Benefits |
|---|---|---|
| Amateur Astronomers | Subscribe to the Minor Planet Center’s real‑time feed; use the open‑source “Find_Orb” software for orbit fitting. | Direct access to raw astrometric data; ability to contribute follow‑up observations that improve orbital solutions. |
| Students (High School & Undergraduate) | Explore NASA’s “Eyes on Asteroids” web app; run simple Monte Carlo simulations with Python notebooks provided by CNEOS. | Interactive visualizations reinforce classroom concepts; hands‑on coding builds data‑science skills. |
| Policy Makers & Emergency Managers | Monitor the CNEOS “Close Approach” table and the weekly PDCO briefing PDFs. | Official risk metrics (Palermo, Torino) and impact timelines support decision‑making and resource allocation. |
| Professional Researchers | Access the full Sentry and Scout databases via the JPL API; retrieve raw SPICE kernels for high‑precision propagation. | Comprehensive datasets enable peer‑reviewed studies and model validation. |
| Citizen‑Science Coordinators | Integrate the “Asteroid Zoo” platform with MPC alerts; organize coordinated observation campaigns. | Leverages global volunteer network to close observation gaps, especially during short‑notice close approaches. |